Space hydrology has a lot to look forward to, thanks in no small part to the French-American SWOT project. Scheduled to launch in 2021, this satellite will be able to measure our rivers’ surface area, height, and slope. In other words, it will be able to see rivers in 3D! As Selma Cherchali, CNES’s Continental surfaces programme manager, explains: “Thanks to SWOT, we will be able to monitor water level and flow variations over a month, a season, or a year. This data will be invaluable to improve current river hydrodynamics models.”
The scientific community is getting ready to make the best of the enormous amount of data SWOT should provide (almost 1 terabyte per day). Another step was taken in April 2017 with GIEMS-D3. This database is the first in the world to map humid areas around the globe and their dynamics from 1993 to 2007, with a surface resolution of 90 m. In 2013, CNES’s own TOSCA programme contributed to the first efforts to break down GIEMS data in preparation for the SWOT project.
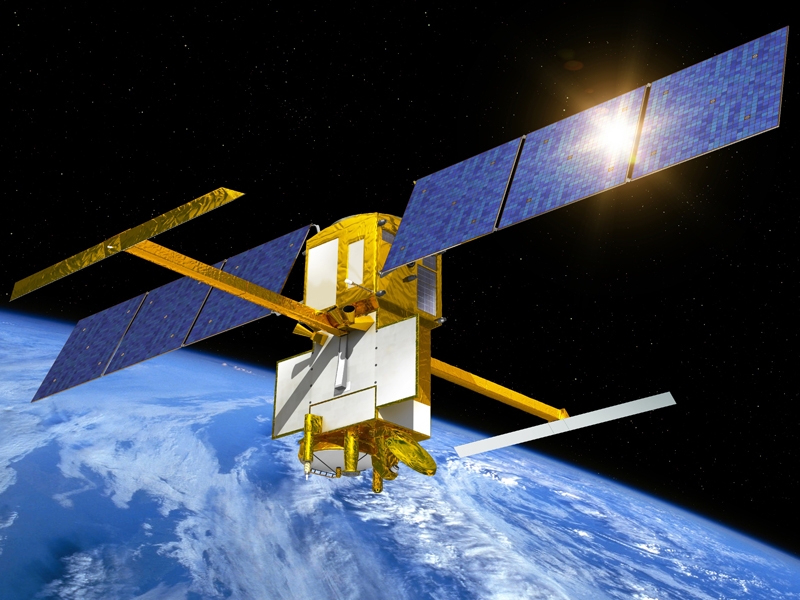
Artist’s impression of the SWOT satellite
(CNES)
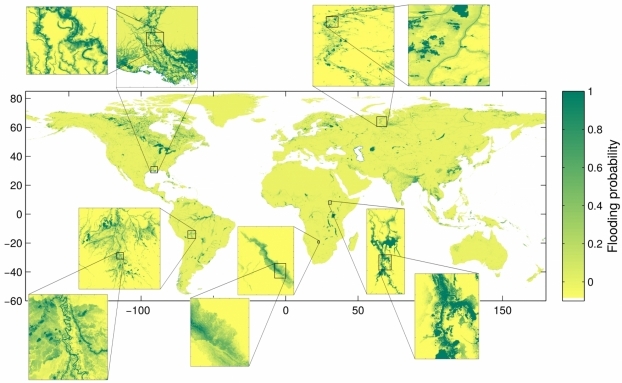
Global flooding probability assessment provided by GIEMS-D3, with zoom-ins on certain rivers and humid areas.
(Aires et al. 2017)
Data from multiple satellites
GIEMS-D3 includes data from multiple satellites equipped with various instruments operating in different electromagnetic wavelengths, including active and passive microwaves, visible light, and infrared. According to Filipe Aires, research director at LERMA in Paris and lead author of the paper published in the Journal of Hydrometeorology, “Passive microwave data provided from radiometers constitute the core of this database. Unlike optical data from Landsat for example, microwave observations can detect water hidden underneath vegetation. This is essential to monitor river basins such as the Amazon or Ganges-Brahmaputra rivers’. SWOT will have the same capabilities.”
To achieve the unprecedented surface resolution of 90 m, researchers also used data from optical instruments on other satellites, as well as big data downscaling methods breaking down spatial images. According to Aires, “When SWOT’s data starts flowing in, this downscaling will be directly done by the satellite instead of on digital field models. This will “extend” SWOT’s results to past data and provide a flooding database going back decades.”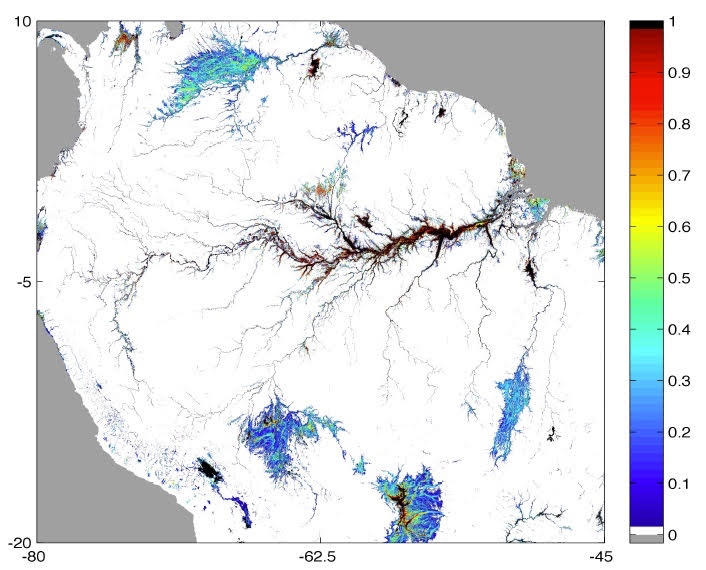
Amazon River basin flood risk assessment from GIEMS-D3 based on data from multiple satellites (Filipe Aires/LERMA)
Next step: extending the database
But why did Aires and his team stop at 2007? Because data wasn’t available! Catherine Prigent, researcher at LERMA and co-author of the paper, explains: “Some of the original data used for GIEMS comes from a NASA database which doesn’t go beyond 2007. Using a new algorithm which bypasses this auxiliary data, we believe we can extend GIEMS data to 2017. At that point, we will be able to include data from the latest European earth observation satellites’ instruments, including the Sentinel-1A radar launched in 2014 and the Sentinel-2A optics launched in 2015”.
A lot of harmonisation and calibration will have to be carried out. It will be done in part through a thesis, co-funded by CNES, which could start in September 2017. Aires concludes: “Our objective is to be able to integrate SWOT data in real time from the moment it starts transmitting from orbit, in order to 1) compare the data with the past 30 years, and 2) begin processing SWOT data as soon as possible. Creating a data series of flood monitoring covering a long period of time takes a lot of calibration on the various instruments involved. But this work is crucial to observe the effects of global warming on ou continents’ hydrology and include them in our models, or to predict and anticipate extreme weather events such as droughts and floods.”
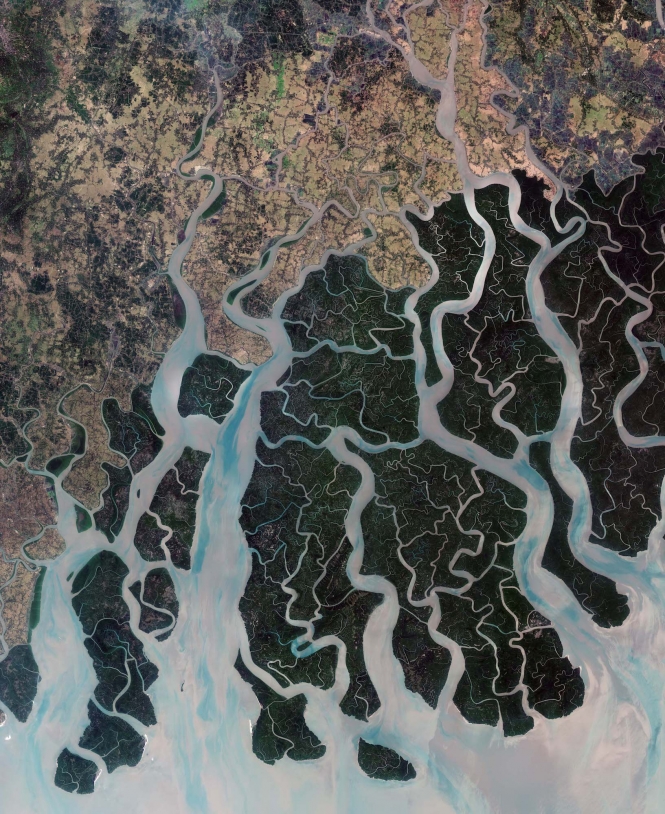
Ganges River delta as observed by the European Sentinel-2A satellite on 17th March 2017
(Copernicus 2017, ESA)
References
- Aires F., L. Miolane, C. Prigent, B. Pham-Duc, E. Fluet-Chouinard, B. Lehner and F. Papa (2017) A Global dynamic and long-term inundation extent dataset at high spatial resolution derived through downscaling of satellite observations, J. Hydrometeor., Volume 18, No. 4, April 2017.
- Aires F., F. Papa, C. Prigent, J.-F. Cretaux and M. Berge-Nguyen (2014) Characterization and downscaling of the inundation extent over the Inner Niger delta using a multi-wavelength retrievals and Modis data, J. of Hydrometeoroloy, 27, 1958-1979.
- Aires F., F. Papa and C. Prigent (2013) A long-term, high-resolution wetland dataset over the Amazon basin, downscaled from a multi-wavelength retrieval using SAR, J. of Hydrometeorology, 14, 594-6007.
Contacts
- Filipe Aires,research director at LERMA (Observatoire de Paris) : filipe.aires at obspm.fr
- Selma Cherchali, Continental surfaces programme manager at CNES : selma.cherchali at cnes.fr